 |
 |
|
Analysing the data A small selection of the graphs produced... |
|
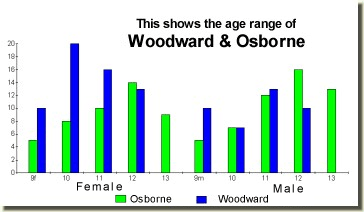
| This graph shows the numbers of children involved in the survey, by sex and age. Woodward Academy surveyed years 5 - 8, and Osborne Middle School surveyed years 5 - 7. |  |
|
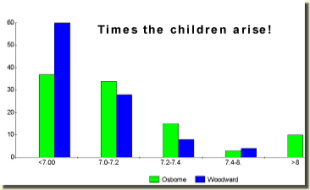
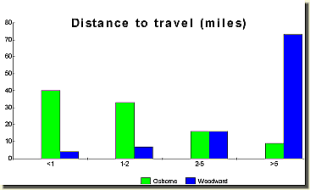
These two graphs show getting up times, and the distance travelled to school.
Woodward Academy children get up earlier, and have further to travel... |
|
 |
 |
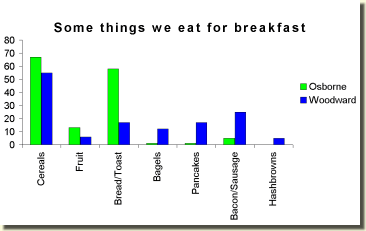
| This graph shows some of the breakfast foods eaten. Woodward Academy children talked about hashbrowns a lot when the survey was being planned, but the survey shows that not many have them for breakfast. Plenty of other discussion points here... |  |
 Produced by Melchior Telematics for BT
Community Partnerships © 1998-9